Attenuation due to liquid water content in the atmosphere
Contents
Correlation between attenuation of 20 GHz satellite communication link and Liquid Water Content in the atmosphere
Maks Kolman, Gregor Kosec, Jožef Stefan Insitute, Department of Communication Systems, Ljubljana.
Abstract
The effect of Liquid Water Content (LWC), i.e. the mass of the water per volume unit of the atmosphere, on the attenuation of a $20$ GHz communication link between a ground antenna and communication satellite is tackled in this paper. The wavelength of $20$ GHz electromagnetic radiation is comparable to the droplet size, consequently the scattering plays an important role in the attenuation. To better understand this phenomenon a correlation between measured LWC and attenuation is analysed. The LWC is usually estimated from the pluviograph rain rate measurements that captures only spatially localized and ground level information about the LWC. In this paper the LWC is extracted also from the reflectivity measurements provided by a $5.6$ GHz weather radar situated in Lisca, Slovenia. The radar measures reflectivity in 3D and therefore a precise spatial dependency of LWC along the communication link is considered. The attenuation is measured with an in-house receiver Ljubljana Station SatProSi 1 that communicates with a geostationary communication satellite ASTRA 3B on the $20$ GHz band.
Introduction
The increasing demands for higher communication capabilities between terrestrial and/or earth-satellite repeaters requires employment of frequency bands above $10$ GHz. Moving to such frequencies the wavelength of electromagnetic radiation (EMR) becomes comparable to the size of water droplets in the atmosphere. Consequently, EMR attenuation due to the scattering on the droplets becomes significant and ultimately dominant factor in the communications quality. During its propagation, the EMR waves encounter different water structures, where it can be absorbed or scattered, causing attenuation. In general, water in all three states is present in the atmosphere, i.e.\ liquid in form of rain, clouds and fog, solid in form of snow and ice crystals, and water vapour, which makes the air humid. Regardless the state, it causes considerable attenuation that has to be considered in designing of the communication strategy. Therefore, in order to effectively introduce high frequency communications into the operative regimes, an adequate knowledge about atmospheric effects on the attenuation has to be elaborated.
In this paper we deal with the attenuation due to the scattering of EMR on a myriad of droplets in the atmosphere that is characterised by LWC or more precisely with Drop Size Distribution (DSD). A discussion on the physical background of the DSD can be found in (E. Villermaux and B. Bossa. Single-drop fragmentation determines size distribution of raindrops, 2009), where authors describe basic mechanisms behind distribution of droplets. Despite the efforts to understand the complex interplay between droplets, ultimately the empirical relations are used. The LWC and DSD can be related to the only involved quantity that we can reliable measure, the rain rate. Recently it has been demonstrated that for high rain rates also the site location plays a role in the DSD due to the local climate conditions.
In general, raindrops can be considered as dielectric blobs of water that
polarize in the presence of an electric field. When introduced to an oscillating
electric field, such as electromagnetic waves, a droplet of water acts as an
antenna and re-radiates the received energy in arbitrary direction causing a net
loss of energy flux towards the receiver. Some part of energy can also be
absorbed by the raindrop, which results in heating. Absorption is the main cause
of energy loss when dealing with raindrops large compared to the wavelength,
whereas scattering is predominant with raindrops smaller than the wavelength.
The very first model for atmospheric scattering was introduced by lord Rayleigh.
The Rayleigh assumed the constant spatial polarization within the droplet. Such
simplifications limits the validity of the model to only relatively small
droplets in comparison to the wavelength of the incident field, i.e.
approximately up to $5$ GHz when EMR scattering on the rain droplets
is considered. A more general model was developed by Mie in 1908, where a
spatial dependent polarization is considered within the droplet, extending the
validity of the model to higher droplet size/EMR wavelength ratios. Later, a
popular empirical model was presented in (J.S. Marshall and W.McK. Palmer. The
distribution of raindrops with size, 1948), where attenuation is related only to
the rain rate. The model, also referred to as Marshall-Palmer model, is widely
used in evaluation of rain rate from reflectivity measured by weather radars.
Marhsall-Palmer model simply states the relation between the attenuation and
rain rate in terms of a power function.
In this paper we seek for correlation between the LWC and attenuation
measurements. LWC is extracted from reflectivity measurements provided by a
weather radar situated in Lisca and operated by Slovenian Environment Agency.
Attenuation is measured by in-house hardware that monitors the signal strength
between Ljubljana Station SatProSi 1 and communication satellite ASTRA 3B. The
main purpose of this paper is therefore to investigate correlation between
precipitation measured in 3D with the meteorological radar and the measured
attenuation.
Governing models
Before we proceed to measurements some basic relations are discussed.
Attenuation ($A$) is a quantity measured in [dB] that describes the loss of electromagnetic radiation propagating through a medium. It is defined with starting intensity $I_s$ and the intensity received after propagation $I_r$ as \[ A = 10\log_{10}\frac{I_s}{I_r}. \] The specific attenuation ($\alpha=A/L$) measured in [dB/km] as a function of rain rate ($R$) measured in [mm/h] is commonly modelled as \[ \alpha(R) \sim a \,R^{b} \ . \] Coefficients $a$ and $b$ are determined empirically by fitting the model to the experimental data. In general, coefficients depend on the incident wave frequency and polarization, and ambient temperature. Some example values for different frequencies are presented in Table 1.
| f[GHz] | 10 | 12 | 15 | 20 | 25 | 30 |
|---|---|---|---|---|---|---|
| $a$ | 0.0094 | 0.0177 | 0.0350 | 0.0722 | 0.1191 | 0.1789 |
| $b$ | 1.273 | 1.211 | 1.143 | 1.083 | 1.044 | 1.007 |
The simplest characterization of rain is through rain rate $R$, measured in [mm/h]. However, rain rate do not give any information about the type of rain. For example a storm and a shower might have the same rain rate, but are comprised of different droplets. Therefore, a more descriptive quantity is a Drop size distribution (DSD) that, unsurprisingly, describes the distribution of droplet sizes. A simple DSD model is presented in (J.S. Marshall and W.McK. Palmer. The distribution of raindrops with size, 1948)
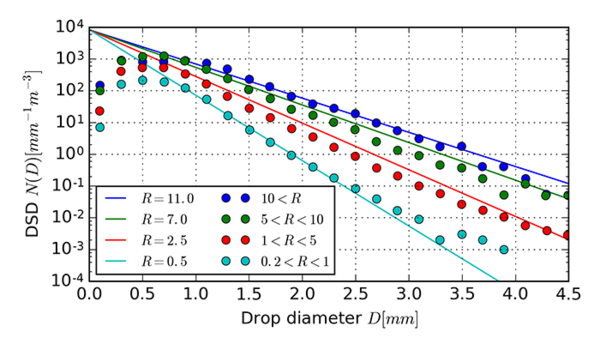
\[ \begin{equation} N(D) = U \exp (-V \, R^{\delta} D), \end{equation} \label{eq:dsdr} \] where $D$ stands for drop diameter measured in [mm], $N(D)$ describes number of droplets of size $D$ to $D + \mathrm dD$ in a unit of volume measured in [$mm^{-1} m^{-3}$] and $R$ rain rate measured in [mm/h]. The values of equation parameters were set to $U=8.3 \cdot 10^3$, $V=4.1$ and $\delta=-0.21$. The DSD was also determined experimentally for different rain rates. The experimental data is presented in Figure 1, where we can see that the typical diameter of droplets is in range of mm. There is a discrepancy between the theoretical and experimental data with very small droplets.
Measurements
Measurements of signal attenuation
Jožef Stefan Institute (JSI) and European Space Agency (ESA) cooperate in SatProSi-Alpha project that includes measuring attenuation of the communication link between ground antenna and a satellite, more precisely between the ASTRA 3B satellite and SatProSi 1 station. The ASTRA 3B is a geostationary communication satellite located on the $23.5^\circ E$ longitude over the equator. It broadcasts the signal at $20$ GHz, which is received at SatProSi 1 with an in-house receiver, namely $1.2$ m parabolic antenna positioned on the top of the JSI main building with a gain of about $47$ dB. The SatProSi measures attenuation every $0.15$ seconds, resulting in over $500000$ daily records, since 1. 10. 2011.
Measurements of rainfall rate
Two sources of rain measurements are used in this paper. The first one is a pluviograph installed locally in the proximity of the antenna. The rain rate is measured every five minutes.
Another, much more sophisticated, measurements of rain characteristics are provided by meteorological radars. The basic idea behind such radars is to measure EMR that reflects from water droplets. The measured reflectivity is then related with rain rate with Marhsall-Palmer relation. Radar reflectivity factor $Z$ is formally defined as the sum of sixth powers of drop diameters over all droplets per unit of volume, which can be converted into an integral \[ Z = \int_0^\infty N(D)D^6 \mathrm dD \ . \] Note that the form of relation follows the Rayleigh scattering model. $Z$ is usually measured in units $ mm^6m^{-3} $. When conducting measurements a so-called Equivalent Reflectivity Factor \[ Z_e = \frac{\eta \lambda^4}{0.93 \pi^5} \] is used, where $\eta$ means reflectivity, $\lambda$ is radar wavelength and $0.93$ stands for dielectric factor of water. As the name suggests both are equivalent for large wavelengths compared to the drop sizes, as in Rayleigh model.
Reflectivity factor and rainfall rate are related through Marshall-Palmer relation as
\[
Z_{[mm^6m^{-3}]} = \tilde a R_{[mm/h]}^{\tilde{b}}\ ,
\]
where $Z_{[mm^6m^{-3}]}$ is reflectivity factor measured in $mm^6m^{-3}$ and $R_{[mm/h]}$ is rainfall rate measured in mm/h. In general, empirical coefficients $\tilde a$ and $\tilde b$ vary with location and/or season, however, are independent of rainfall $R$. Most widely used values are $\tilde a=200$ and $\tilde b=1.6$.
Meteorologists rather use dimensionless logarithmic scale and define
\[
\mathit{dBZ} = 10 \, \log_{10} \frac{Z}{Z_0} = 10 \, \log_{10} Z_{[mm^6m^{-3}]}\ ,
\]
where $Z_0$ is reflectivity factor equivalent to one droplet of diameter $1$ mm per cubic meter.
The meteorological radars at Lisca emit short ($1$ microsecond) electromagnetic pulses with the frequency of $5.62$ GHz and measure strength of the reflection from different points in their path. Radar collect roughly $650000$ spatial data points per radar per every atmosphere scan, which they do every $10$ minutes. They determine the exact location of all their measurements through their direction and the time it takes for the signal to reflect back to the radar.
In addition to reflectivity radars also measure the radial velocity of the reflecting particles by measuring the Doppler shift of the received EMR, but this is a feature we will not be using.
Data analysis
The analysis begins with handling approximately $20$ GB of radar data for the academic year 2014/15 accompanied with $3$ GB of signal attenuation data for the same time period and approximately $5$ GB of attenuation and local rain gauge data for years 2012 and 2013.
Preprocessing the radar spatial data
Radar data was firstly reduced by eliminating spatial points far away from our point of interest, namely the JSI main building where antenna is located. The geostationary orbit is $35786$ km above the sea level, therefore the link between the antenna and the satellite has a steep elevation angle $36.3^\circ$. In fact just $20$ km south of the antenna the ray rises above $15$ km, which is the upper boundary for all weather activities. Knowing this, a smaller area of the map can be safely cropped out, reducing the number of data points from around $650000$ to approximately $6500$ for each radar scan covering an $40 \text{km} \times 40 \text{km}$ area.
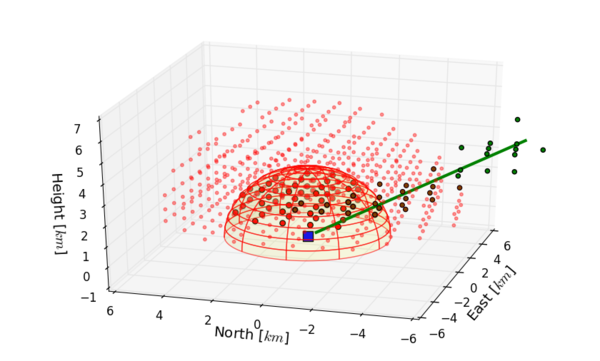
Although we already gravely reduced original data size, we must still reduce thousands of points into something tangible. The positions of both the antenna and the satellite are known at all times, a lovely consequence of them being stationary; therefore the link between them can be easily traced. Roughly $150$ points on the ray path are used as a discrete representation of the link, referred to as link points in future discussions. For each link point a median of $n$ closest radar measurements is computed as a representative value. The other way of extracting reflectivity factor was simply to take closest $n$ points to the antenna and select the median value of those. A visualisation of both methods is presented in Figure 2.
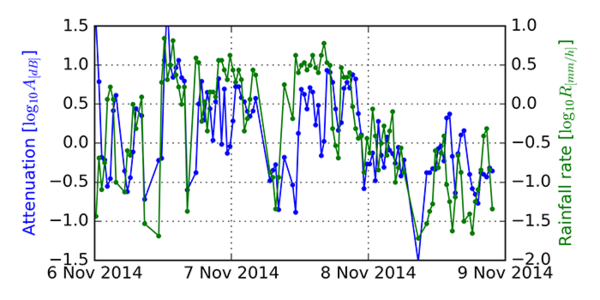
Now we are left with multiple scalar quantities as a function of time. Antenna attenuation for every $0.15$ s, local rain gauge for every $5$ min and various extractions of reflectivity factor for every $10$ min. Note, that radar values are not averaged over $10$ minutes, radar simply needs $10$ minutes to complete a single scan. In Figure 3 an example of rainfall rate measured with weather radar and the measured attenuation for a three day period is presented. A correlation between quantities is clearly seen on the figure but a closer inspection is needed to reveal more details about the correlation.
Correlation between rain and attenuation
In order to find a relation between rain rate and electromagnetic attenuation, measurements of both quantities must be paired. There is no obvious way of doing this since both are measured at a vastly different time-scale. We ended up dividing time into bins of duration $t_0$ and pairing the measurements that fall within the same bin. The maximum values of every quantity was selected as a representative for the given time period.
The correlation coefficient between two variables $X$ and $Y$ can be calculated using \[ corr(X, Y)=\frac{\text{mean}((X - \text{mean}(X))\cdot(Y - \text{mean}(Y)))}{\text{std}(X)\text{std}(Y)} \] and is a good quantity for determining linear dependence between $X$ and $Y$.
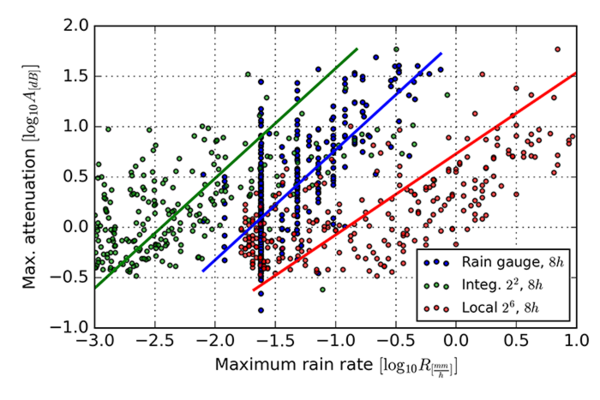
According to the Marshall-Palmer power law a linear relation exists between logarithms of rain rate and specific attenuation. Our measurements are of total attenuation $A$ and not of specific attenuation so we must adjust the equation. We assume a typical distance $L$ as a connecting factor between the, which gives us \[ \log_{10}A = \log_{10}La + b\log_{10}R . \] The exact value of $L$ is not relevant as only the parameter $b$ will interest us. Therefore a slope on a log-log graph, such as on Figure 4, is equal to the model parameter $b$. We used a least square linear fit on each set of data to get the corresponding values for $b$.
In addition, correlation between logarithmic values of rain rate and attenuation \[ corr\left(\log_{10}A_{[\text{dB}]}, \log_{10}R_{[\text{mm/h}]}\right) \] is used as a quality measure of their relation.
Results and discussion
Once we paired attenuation and rainfall data we can scatter the points on a graph. In Figure 4 the attenuation against rain rate at $8$ h bin size is presented. For the local radar representation $n=2^6$ and for integral representation $n=2^2$ support size is used. The correlation can be clearly seen, however not unified, as one would expect if measurements and rain rate - reflectivity model would be perfect. Since we introduced two free parameters, namely time bin $t_0$ and spatial support size $n$ for integral and $n$ for local radar representation, a sensitivity analyses regarding those parameters are needed.
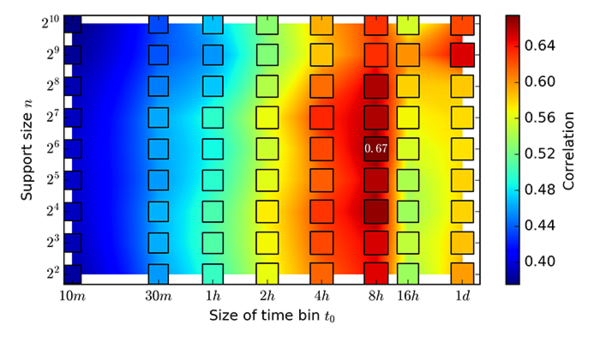
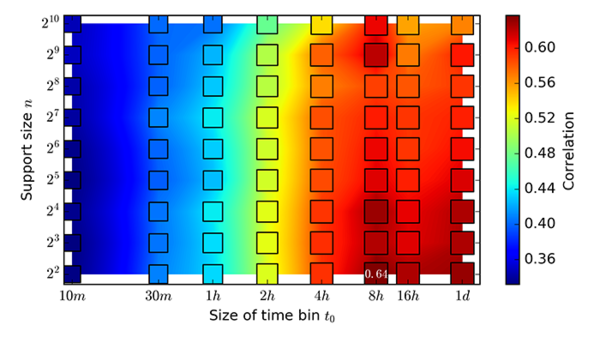
In Figure 5 a correlation with respect to the number of local support nodes and time bin size is presented. The best correlation is obtained with $8$ h time bins and a local $n=2^6$ support size.
Similarly a correlation with respect to the number of integral support nodes and time bin size is presented in Figure 6. Again, the best correlation is obtained with 8 h time bins, however with the integral model a small integral support, i.e.\ $n=2^2$, already suffices to obtain fair correlation. Such behaviour is expected. In an integral mode we follow the ray and support is moving along, therefore there is no need to capture vast regions for each link point. On the other hand in a local approach only one support is used and therefore that support has to be much bigger to capture enough details about the rain conditions.
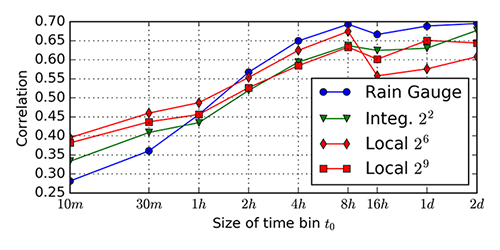
To compare measurements acquired with radar and the ones acquired with the local rain gauge a simpler presentation of correlation is shown on Figure 7. One set of data has rain rate extracted from radar using the integral method with support size $4$ and two sets using closest either $n=64$ or $n=512$ nodes.
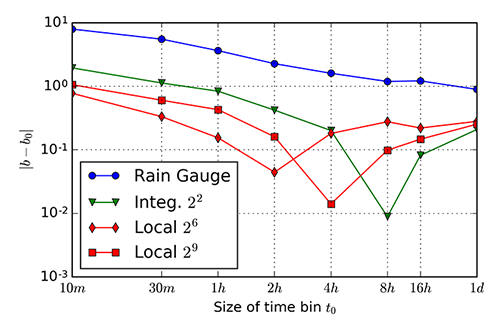
In the next step we compare our measurements with a Marshall-Palmer model, specifically the exponent $b$. According to Table 1 in $20$ GHz the $b_0=1.083$ should hold. In Figure 8 differences between our measurements and $b_0$ with respect to the time bin size are presented for the same sets of data as were used in the correlation analysis of Figure 7. An order of magnitude improvement is visible between local rain gauge and data extracted with radar.
Conclusion
This paper deals with the correlation analysis between EMR attenuation due to the scattering on the ASTRA 3B - SatProSi 1 link and measured rain rate. The main objective of the paper is to analyse the related measurements and comparison of results with Marshall-Palmer model.
The attenuation is measured directly with an in-house equipment with a relatively high time resolution ($0.15$ s).
The rain characteristics are measured with a rain gauge positioned next to the antenna and national meteorological radar. The rain gauge measures average rain rate every five minutes at a single position, while the radar provides a full 3D scan of reflectivity every $10$ minutes.
Although the attenuation depends mainly on the DSD, a rain rate is used as a reference quantity, since it is much more descriptive, as well as easier to measure. The reflectivity measured with the radar is therefore transformed to the rain rate with the Marshall-Palmer relation. More direct approach would be to relate the attenuation with the measured reflectivity directly, however that would not change any of the conclusions, since, on a logarithmic scale, a simple power relation between reflectivity and rain rate reflects only as a linear transformation.
The analysis of support size and time bin size showed quite strong influence of those two parameters on the correlation. It is demonstrated that time bin $8h$ and support sizes of $n=2^6$ and $n=2^2$ for local and integral approach, respectively, provide a decent correlation ($0.6-0.7$) between logarithms of measured attenuation and rain rate.
Furthermore, the power model has been fitted over measured data and the value of the exponent has been compared to the values reported in the literature. The model shows best agreement with the Marshall-Palmer model, when the rain rate is gathered from the integral along the communication link. somewhat worse agreement is achieved with a local determination of rain rate. Results obtained with the rain gauge are the furthest from the expected, despite the fact that the correlation with the measured attenuation is the highest with the rain gauge measurements. The localized information from the rain gauge simply cannot provide enough information to fully characterize the rain conditions along the link.
There are still some open questions to resolve, e.g. what is the reason behind the $8$ h time bin giving the best result, how could we improve the correlation, using different statistics to get more information from the data, etc. All these topics will be addressed in future work.
Acknowledgment
The authors acknowledge the financial support from the state budget by the Slovenian Research Agency under Grant P2-0095. Attenuation data was collected in the framework of the ESA-PECS project SatProSi-Alpha. Slovenian Environment Agency provided us with the data collected by their weather radars.
