Analysis of dynamic thermal rating in TransnetBW using measured weather data
The transfer capabilities of overhead power lines are limited by the critical power line temperature that depends on the magnitude of the transferred current and the ambient conditions. To utilize existing power lines more effectively and more safely, concerning the critical power line temperatures, and to enforce safety measures during potentially dangerous events, Dynamic Thermal Rating (DTR) systems have been developed for the past 30 years. DTR allows transmission system operator (TSO) to monitor and predict the maximal allowed ampacity (transfer capability) of the power grid based on weather measurements and forecast systems.
This project was a pilot project with German TSO TransnetBW with the goal to provide weather data analysis and dynamic thermal rating evaluation to assist TransnetBW in better understanding of their system and to maximise the use of dynamic line rating.
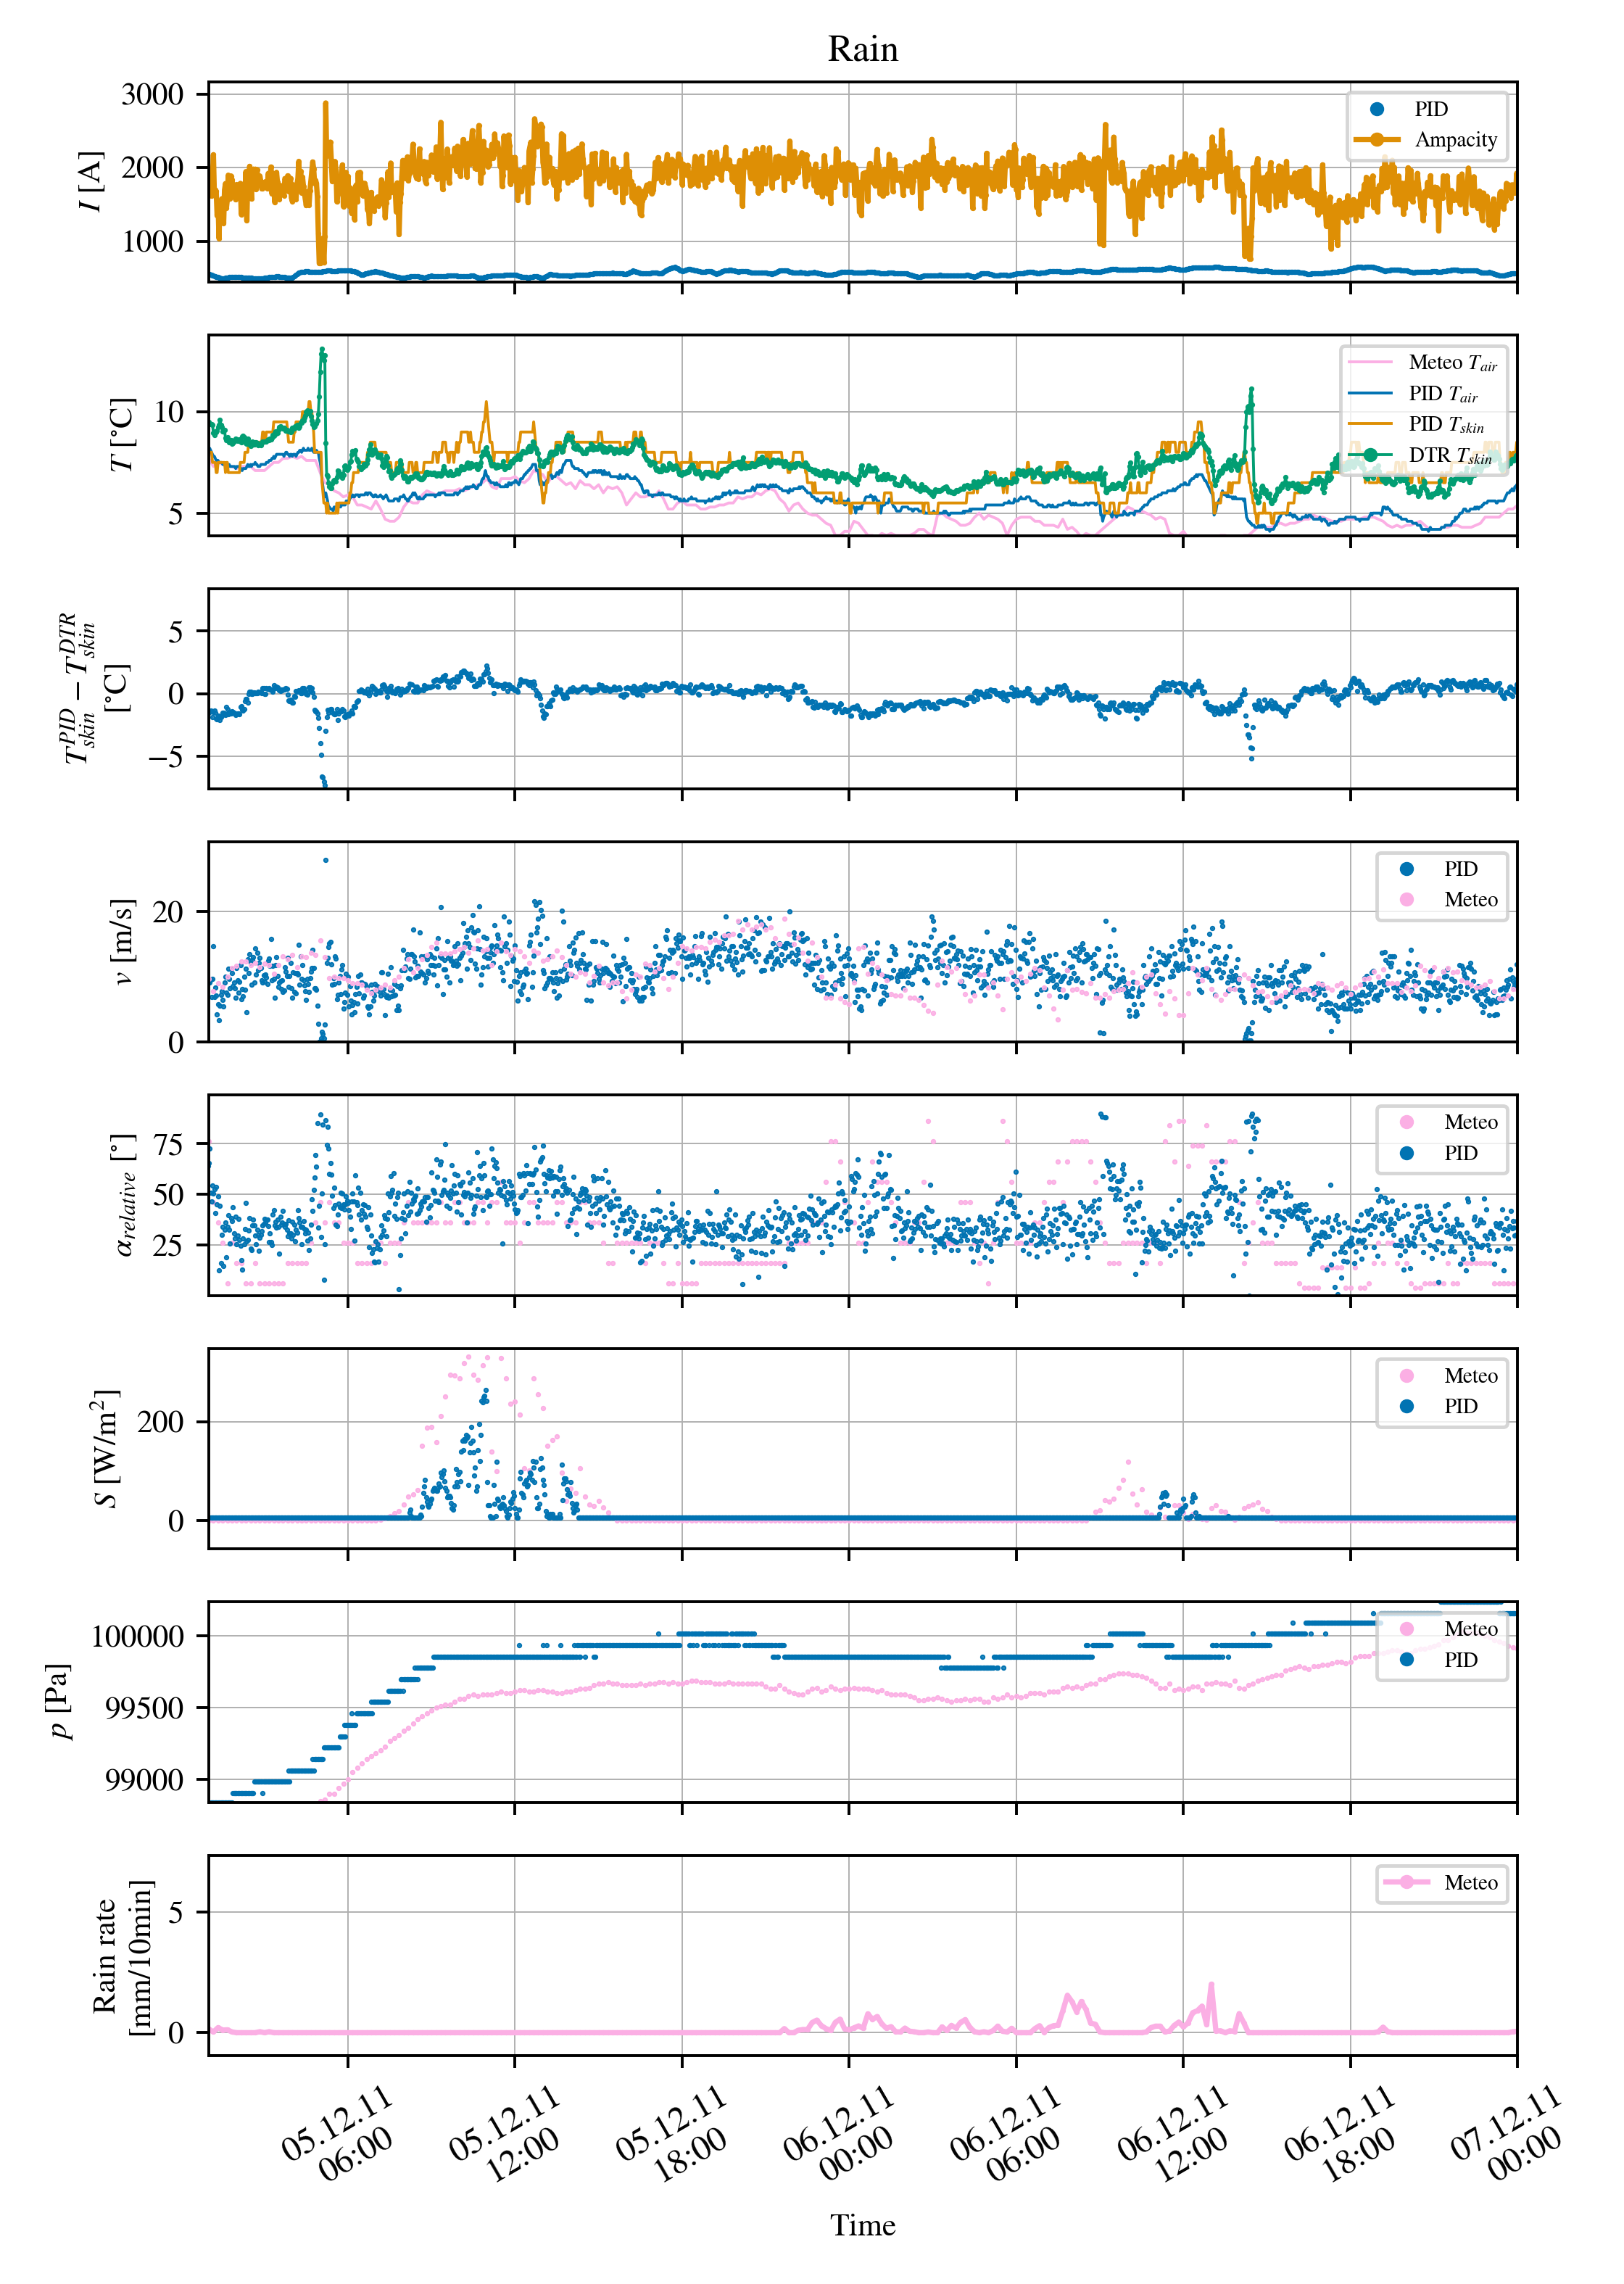
TransnetBW provided power line properties, weather and current measurements from 3 different sensor, for one location in time interval from April 2011 to June 2014 and from July 2018 until the beginning of the project. We first assessed the quality of the provided data and performed some basic statistical analysis. Additionally, we used meteorological data from Der Deutsche Wetterdienst weather station, located 17 km from the point of interest as an independent measurement source. We looked at the intervals with missing or corrupt data and interpolated the missing data where possible, to obtain the intervals with all of the variables needed for DTR simulations.
We used CIGRE TB601 based algorithm, written in C++14 and parametrised the 243-AL1/39-ST1A type power line according to the data provided by TransnetBW, standard recommendations and data from the scientific literature. We then run the DTR simulations. We first established confidence in the DTR model by a static temperature rise test and basic sensitivity analysis. We compared the computed temperatures with the measured ones, and looked at some examples with different weather scenarios.
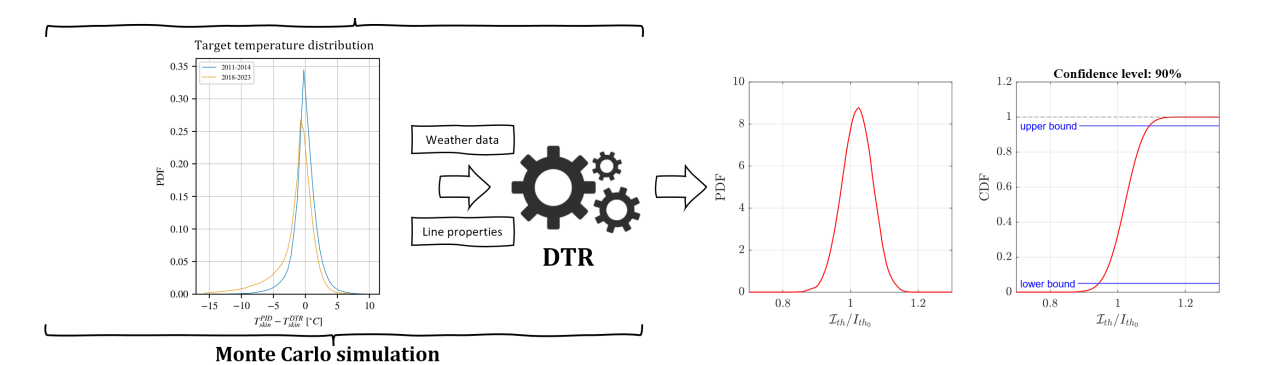
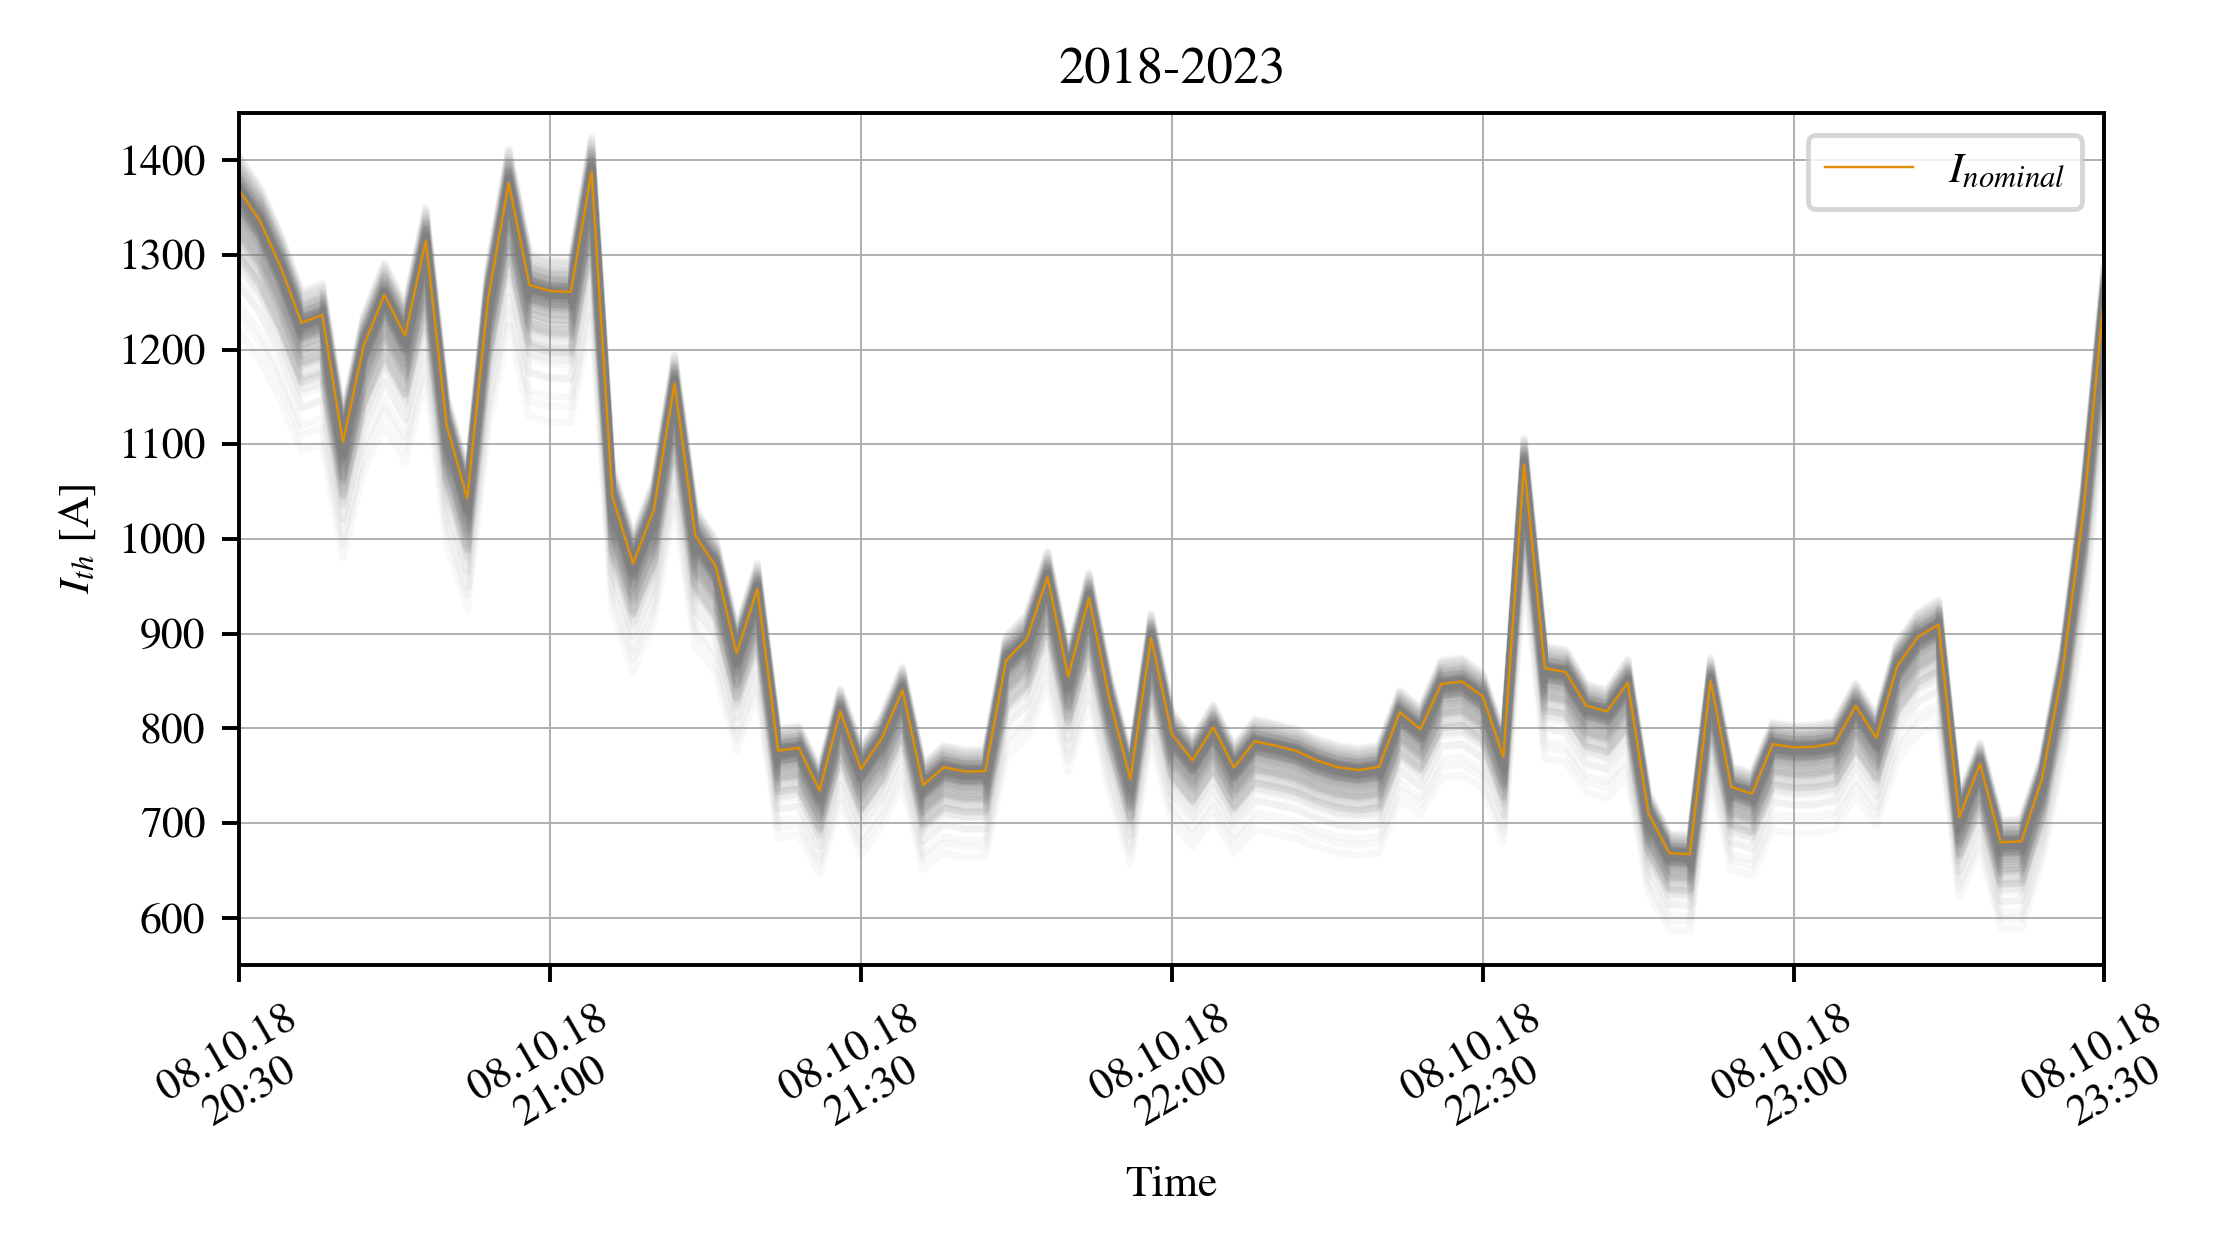
We next discussed the ampacity distributions, and examined cases where dynamic ampacity falls under the static limit. We addressed the ampacity distribution uncertainty, where we used Monte Carlo simulations to generate distributions of ampacity. We simulated the uncertainty of the input parameters via the DTR error, which was evaluated as the difference between the calculated and measured skin temperature. We showed how the implementation of DTR in the system would increase the operating capacities.