
Forecasting tap changer regulatory maintenance with advanced analytics
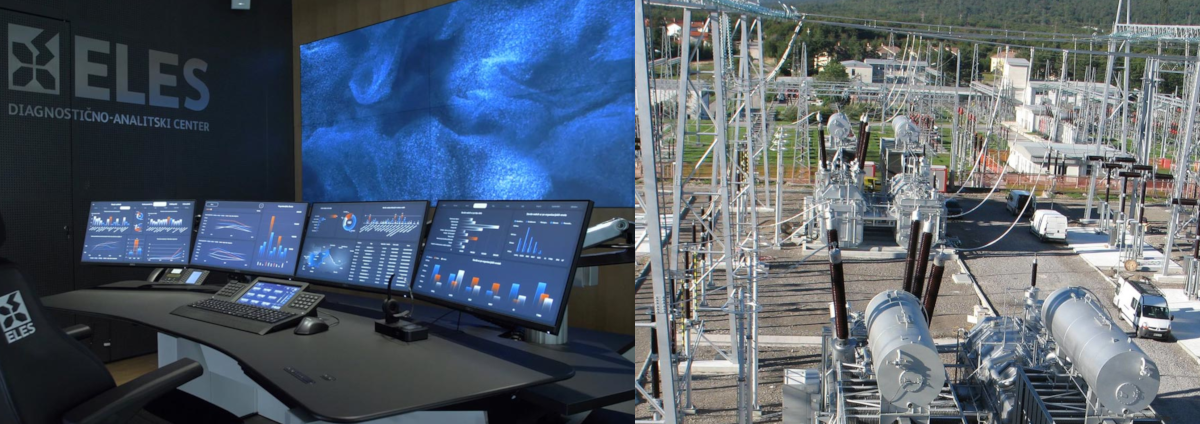
The Diagnostics and Analytics Centre (DAC) of the Slovenian power transmission operator (ELES) is a meeting point for mass data, advanced analytics, technical expertise and good engineering practices, which are translated by data engineers and scientists into modern management of ELES assets. DAC worked with JSI to bring modern data analytics into the optimization of maintenance costs of several transformer units that utilize on-load tap changers (OLTC). The engineers overseeing the transformer need to frequently change the unit’s configuration to fit the electricity demands of the nearby regions. This is done with a tap changer, which can select an appropriate tap from a number of options to control either the phase angle or the voltage ratio of the transformer. Regular maintenance is performed after a certain number of tap changes are completed as well as upon reaching a set number of changes from and to the most commonly used tap. ELES wishes to plan future maintenance, which requires the use of robust prediction models for these two quantities. JSI has developed appropriate models, which base their predictions on the data about tap changes collected in the past.
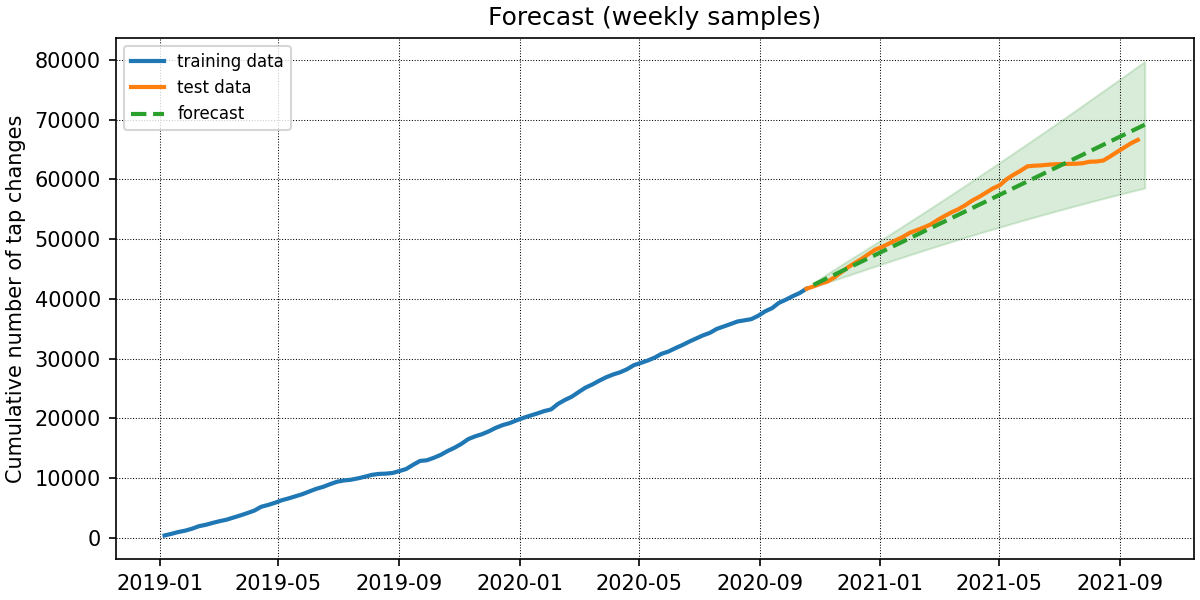
To plan for the maintenance that will be required after a given number of tap changes, we have developed a prediction model for the cumulative number of tap changes for a given OLTC.
A series of sudden local trend changes make accurate predictions difficult. After having tested several models from machine learning (linear regression, regression and model trees, random forests with and without bagging) to linear Bayesian dynamic models and ARIMA models of varying complexity, we found that a simple ARIMA model provides the best performance. Adding additional information into the model via covariates such as current electricity demand in nearby areas did not consistently improve the prediction and seemed to unnecessarily complicate the model. One component that did help, however, was a relatively strong seasonality in the data, which we have accounted for. Additionally, we used a variant of the bootstrap method to extend the prediction with confidence interval.

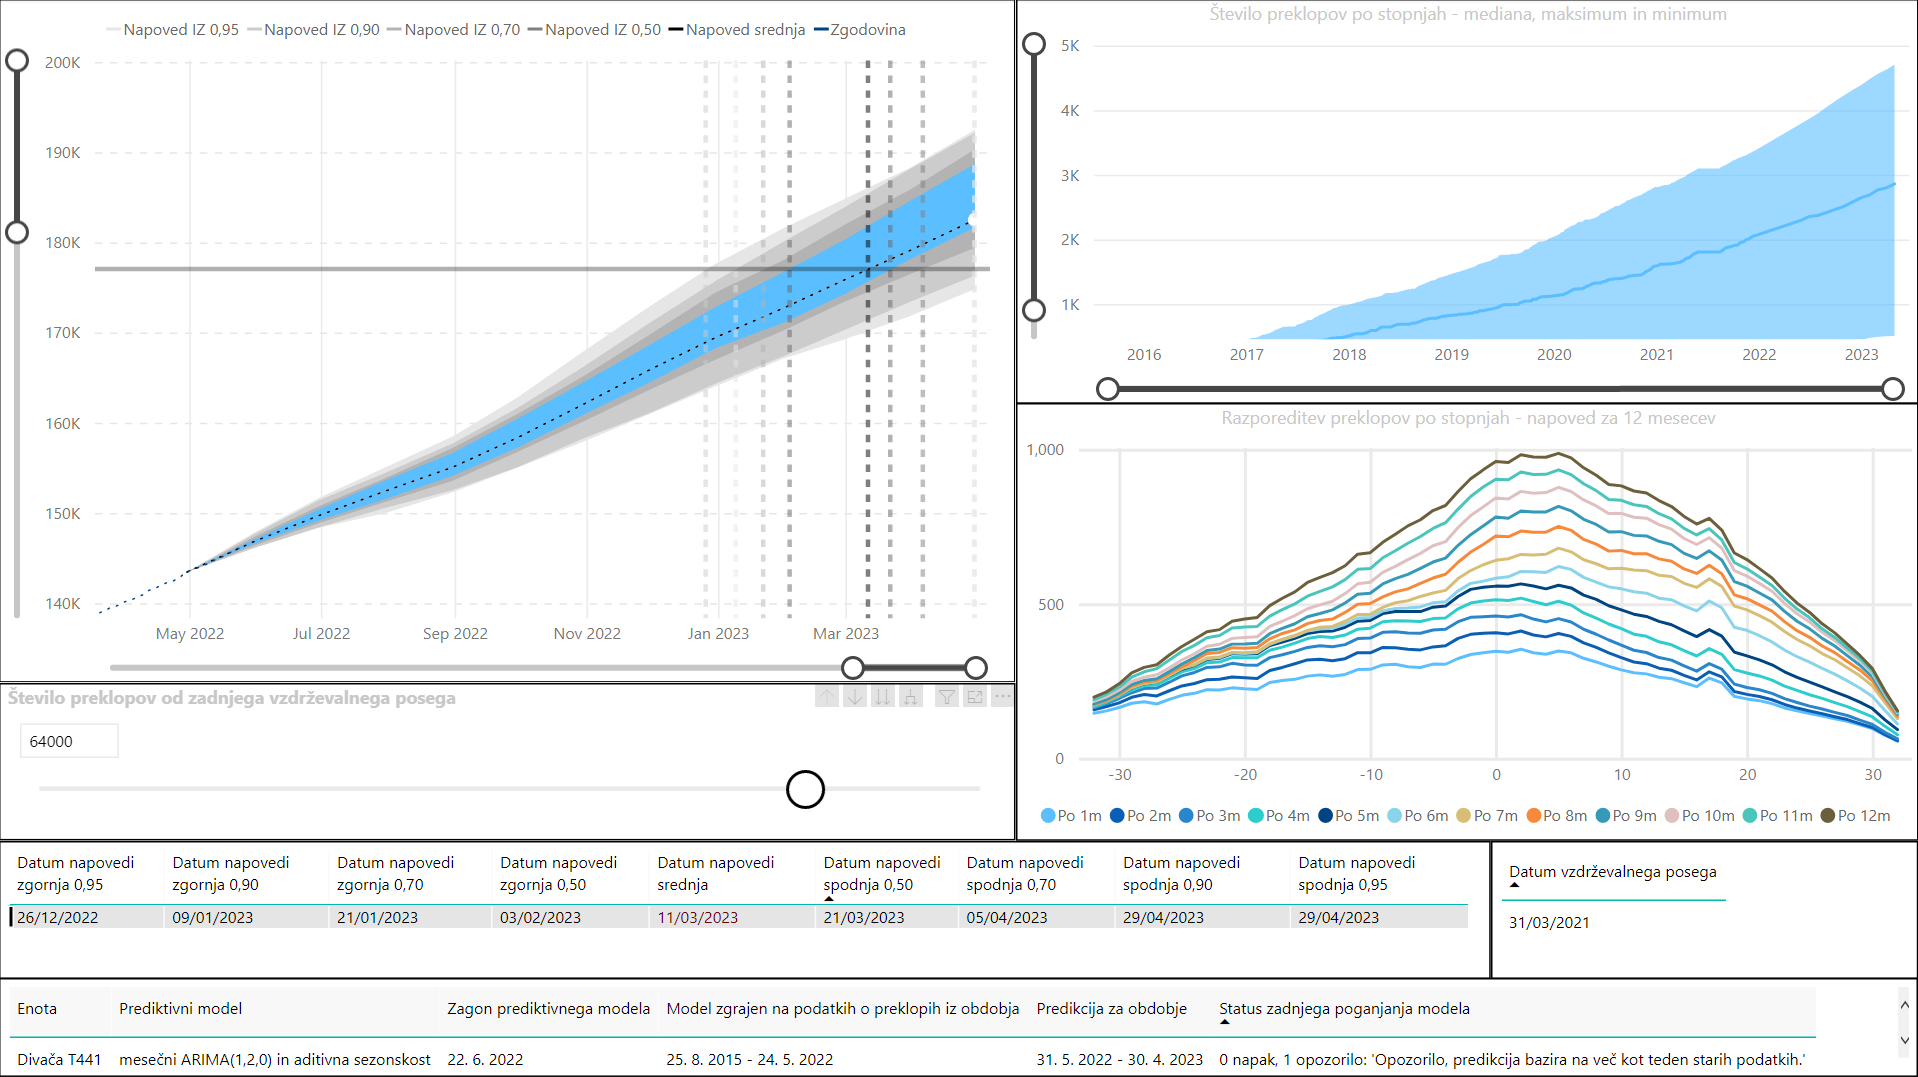
The second maintenance condition, that has not yet been used, is reaching the threshold number of changes on the tap that is changed to or from the most. We found that the distributions of switches over different positions also exhibit strong yearly seasonality. Therefore we developed a prediction model by extending the cumulative model with a model of normalized monthly distribution of changes over individual taps. Using these two models, maintenance can be planned better - the prediction for the total number of tap changes can be transformed into a prediction of the number of tap changes on a specific position. The relevant quantity, number of tap changes to or from the most visited tap, is then simply the maximum value over the taps.
The majority of our analysis was done using the data from OLTC installed in a phase-shifting transformer (PST) with significantly more chaotic taps changes compared the rest of OLTC units that are were to be modelled. This makes the prediction for other units simpler and we have verified that the model did not require adjustments to be used on these other units as well.
Besides developing the prediction models, we have also implemented them in the environment used by DAC. The implementation comprises a server which performs periodic re-modelling from new data collected from an SQL database. Models are then used to make predictions for up to one year in the future and report their results into the database. At any time can then the predictions be displayed by Power BI from any network connected workstation in DAC.
Partners
Jozef Stefan Institute (JSI)
ELES Diagnostics and Analytics Centre (ELES DAC)